Amazon, Microsoft, Google, and Apple: The Reality of Large-scale Corporate Decarbonization
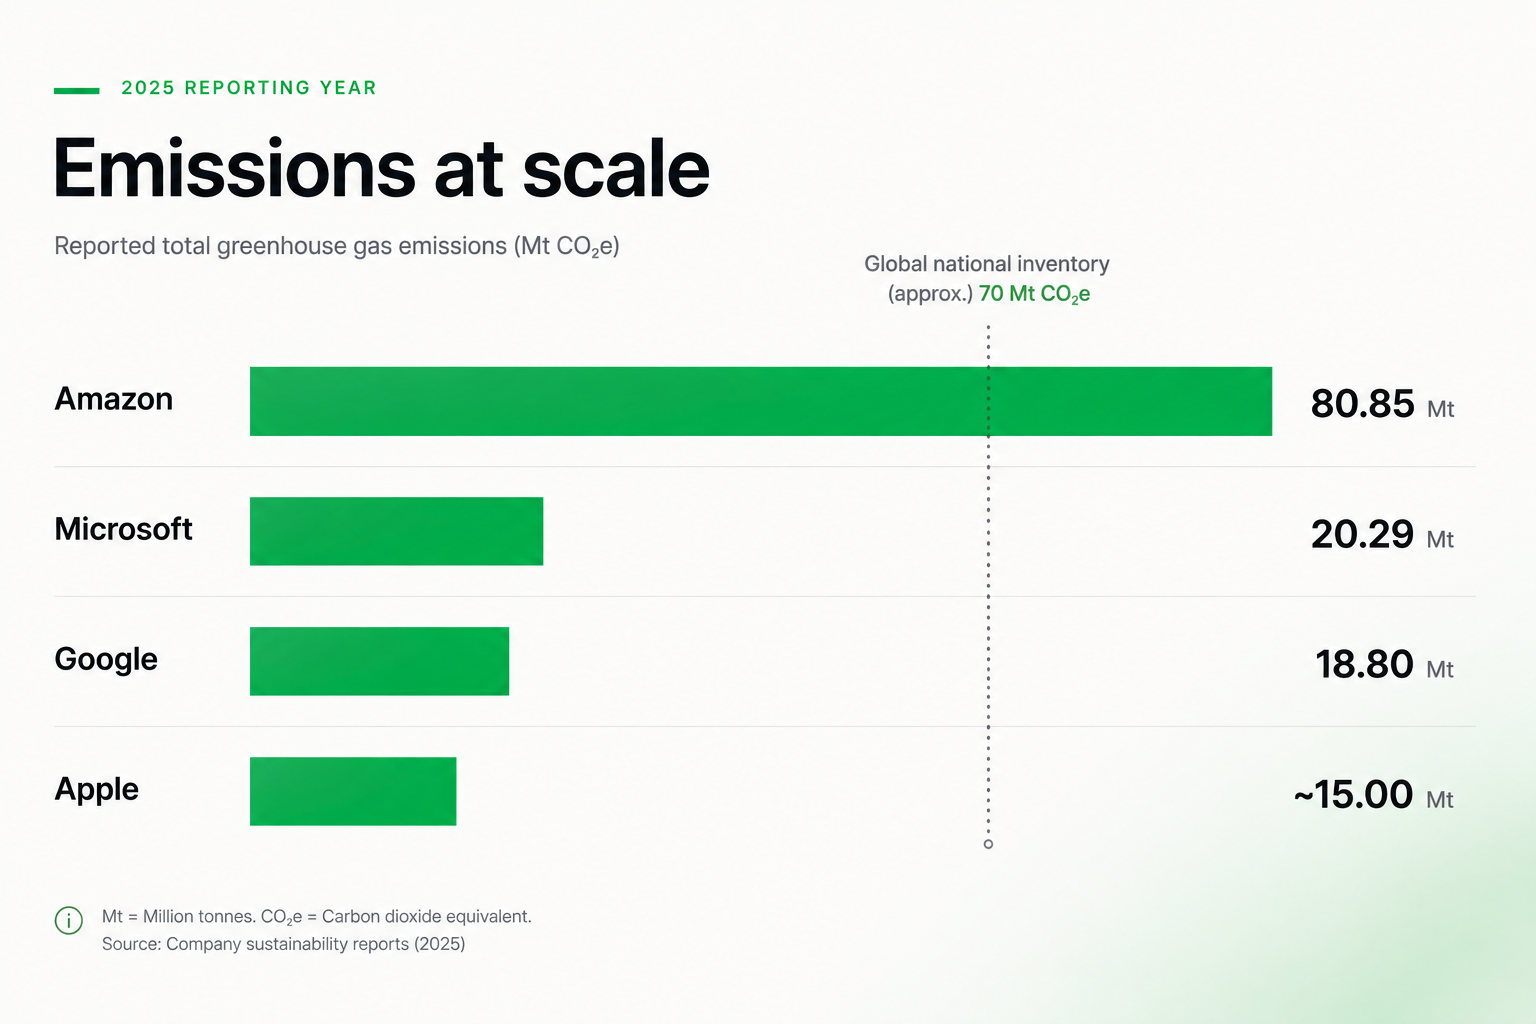
Amazon, Microsoft, Google and Apple published their latest environmental reports within a few months of each other. While the revenue numbers were some of the highest we’ve ever seen, the emissions figures were not getting much lower. In fact, these companies reported roughly 131 million tonnes of CO2e between each other.
This number is notably large and highlights that there are still significant roadblocks to decarbonization. Despite growing regulatory pressure and increased ESG-related governance, emissions figures remain difficult to cut down.
These four companies are united by their size and global scale, but it is worth noting that their focuses are different. Amazon runs retail, logistics, groceries, media and the world's largest cloud platform, with more than 1.5 million employees. Apple sells hardware and services. Google monetises search, YouTube and advertising while scaling a cloud business. Microsoft sells enterprise software, Azure, devices and gaming, with Windows alone running on over a billion active devices. What they share is a position at the top of the corporate hierarchy: they are the largest corporate buyers of clean energy, they set environmental requirements for tens of thousands of suppliers, and their disclosures are often treated as the reference standard for what serious corporate climate work looks like.
All of this raises the question of why (and how) emissions still sit at such a large figure? In this article we will look more closely at these companies’ recent environmental reports and investigate where their efforts are being concentrated and how successful these efforts have been.
The Emissions Data
Here are some of the headline figures for the 2025 reporting year:
Amazon: 80.85 Mt CO2e, up 16%. Supply chain emissions account for 76% of the total and rose 20%. Direct operations account for 19% and rose 2%. Purchased electricity accounts for just 5% but rose 34%, driven by data centres and fleet electrification.
Microsoft: 20.29 Mt CO2e in FY25, up 25%. Scope 3 remains the largest share, but the notable movement was Scope 2, which jumped from roughly 2% to 13% of the total.
Google: approximately 14.5 Mt CO2e, up 18%, and 81% above its 2019 baseline. Scope 3 makes up around 80% of the footprint and grew 25%. Scope 1 is under 1% of the total but rose 20% on backup generator use. Scope 2 fell 3%, even as total electricity load grew 37%.
Apple: approximately 15 Mt CO2e, effectively flat. Emissions remain more than 60% below the 2015 baseline, holding constant year over year during a period of business growth.
These numbers can feel abstract when isolated, especially when the figures are so large. Carbon intensity is easier to understand and act on, because it reveals the relationship between revenue and sustainable reductions. Dividing reported emissions by reported revenue gives a rough figure for grams of CO2e per dollar earned:
Amazon: 112.8 g/$
Microsoft: approximately 72 g/$
Google: approximately 36 g/$
Apple: approximately 36 g/$
(calculations done based on reported emissions and reported revenue)
What the intensity numbers do show us here is direction. Amazon's five-year trend shows a more positive environmental trajectory, but its 2025 figures on their own are less promising. Emissions per shipped unit fell 7% year over year, and 39% since 2019, while total emissions still climbed 16%.
Set that against the commitments. Google is targeting a 50% absolute cut against its 2019 baseline by 2030 while sitting 81% above it, which implies a reduction of roughly 72% from today's level inside five years. Microsoft is targeting carbon negative by 2030 while reporting a 25% annual increase. Amazon is targeting net zero by 2040, a decade later, and is the only one of the four with a target date that still looks arithmetically comfortable. Apple, at more than 60% below its 2015 baseline against a 75% reduction target, is the only company of the four whose trajectory currently resembles its stated ambition.
Why Are the Numbers Still So High?
A large chunk of the emissions belong to someone else. Scope 3 accounts for around 80% of Google's footprint, 76% of Amazon's, and the largest share of Microsoft's. These are emissions embedded in semiconductor fabrication, server manufacturing, construction materials and third-party freight, largely produced in Asia-Pacific grids where fossil generation still dominates. The issue is procurement and supplier engagement, not capital projects the company controls. In fact, Amazon engaged the top suppliers representing 70% of its supply chain emissions, and 62% of them now have credible decarbonisation plans, a 23% year-over-year improvement. Google has launched a Clean Energy Addendum asking key hardware suppliers to run on 100% clean electricity by the end of 2029, with more than 75 signed so far and an estimated abatement potential of up to 8 Mt. Both companies have evidenced their commitment to these plans, but neither of them show up in this year’s figures.
The growth is rooted in physical materials. AI infrastructure is concrete, steel, copper and land before it is cloud compute. Microsoft notes that concrete and steel account for roughly 8% and 7% of global CO2 emissions respectively. Google attributes around 2.3 Mt of its 2025 Scope 3 emissions — about 20% of the Scope 3 total. Amazon used lower-carbon materials on 61 building projects in 2025 and avoided 195,000 tonnes of embodied CO2e as a result, which is an environmentally-conscious engineering decision and also 0.24% of its annual footprint. That ratio is the honest measure of how early this work is and how much more needs to be done.
The accounting itself is an important variable. A material part of Microsoft's 25% increase was a decision rather than an outcome: the company stopped using non-additional, unbundled renewable energy certificates in favour of investments that add new power to grids, which pushed reported Scope 2 up sharply in the near term. This tells us that they have chosen to accept a worse headline number in exchange for a better long-run one. It also highlights the difficulty of comparing these companies against each other, as each approach decarbonization with different strategies and benchmarks. Comparing headline totals across companies with different boundaries, methodologies and certificate policies will produce an interesting ranking, but less real insight.
Underneath all three elements sits electricity demand. Google's load grew 37% in a single year. The IEA now projects global data centre electricity consumption roughly doubling from 485 TWh in 2025 to around 950 TWh in 2030, with AI-focused capacity tripling in that window. Companies are having to put in more work with efficiency as a result of this growth and their estimates show success: Amazon reports a global data centre PUE of 1.14, Microsoft 1.17, and Google estimates that hardware, software and clean energy interventions avoided more than 58 Mt in 2025, without which its footprint would have been roughly five times larger.
What Next?
Each company appears to be now concentrating effort in a slightly different place.
Amazon is betting on energy supply. More than 712 carbon-free energy projects across 30 countries, representing 42 GW of capacity, plus small modular reactor investment through X-energy and 1,900 MW of contracted nuclear from Talen Energy through 2042.
Microsoft is betting on markets that do not exist yet. It added 29 carbon dioxide removal projects in FY25, expected to contribute more than 45 million tonnes over three decades, and signed a seven-year green steel agreement with Stegra for material produced with up to 95% lower emissions.
Google is betting on clean power procurement and supplier electricity. Over 12 GW of net-new clean energy contracted in 2025, its largest year on record, though average carbon-free energy across operations held at roughly 65%, which is essentially flat on the prior year despite the procurement.
Apple is betting on the supply chain it already controls tightly. Direct suppliers procured more than 20 GW of renewable energy in 2025, 30% of material shipped in products came from recycled content, and packaging is now fully fibre-based.
The newest common pursuit is freshwater. Microsoft replenished over 14.2 million cubic metres in FY25, exceeding its global withdrawals for the first time, and has improved data centre water use effectiveness by 25% since 2022. Amazon reached 75% of its 2030 water positive goal, up from 53%, with WUE down to 0.12 L/kWh. Google replenished approximately 7.7 billion gallons, around 78% of its freshwater consumption. Apple replenished more than half the water withdrawn for its global facilities, up sharply on the prior year's position.
Water progress looks faster than carbon progress, and it is worth thinking about why this is the case. Replenishment volumes can be contracted and watershed projects can be funded, verified and counted inside a single reporting cycle without too much difficulty. Supply chain decarbonization on the other hand cannot: it depends on grid mix in jurisdictions the buyer does not control, on capital investment cycles at tier-two and tier-three suppliers, and on primary data that most of those suppliers do not yet have available. The area showing the fastest visible progress is the area where progress is easier to achieve.
Which brings the problem back to evidence. All four companies are asking to be judged on trajectory rather than on a single year, and that is a reasonable request. It is only reasonable, though, if the trajectory is visible consistently and backed up with real evidence. These reports arrive six to twelve months after the period they describe, aggregated to a level that makes intervention impossible. Meanwhile CSRD assurance requirements, California's disclosure rules and customer-level Scope 3 requests all operate on shorter cycles than the annual report. The companies buying from these four, and the companies inside their supplier programmes, are being asked for supplier-level emissions evidence continuously. Platforms built to hold and update Scope 3 supplier data as it changes, rather than reconstructing it once a year, are better positioned for that than a reporting process designed around an annual publication date.
The four reports agree on the underlying story. Efficiency per unit of compute, per shipped package and per dollar of revenue is improving, in some cases dramatically. However, absolute emissions are rising anyway, because growth is outpacing every intervention deployed against it. This places more pressure on balancing ambition with environmental progress and provides us with some insight on how difficult it is becoming to decarbonize at speed and scale.
Companies now need to make sure that their sustainable development steps are bigger than the earlier ones, and 2030 is now four years away. If the largest and best-capitalised climate programmes in the world cannot bend an absolute curve inside their own reporting horizon, what exactly is everyone else's plan supposed to look like?